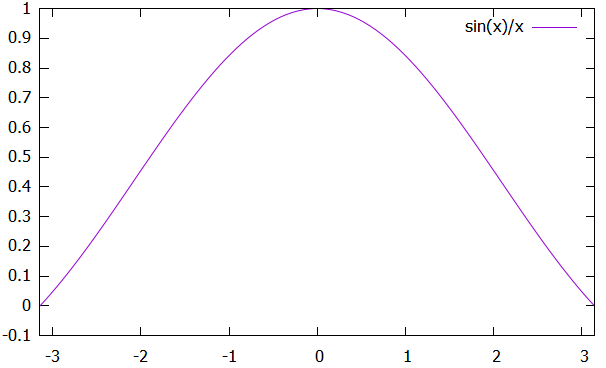
set xrange [-pi:pi]
plot sin(x)/x
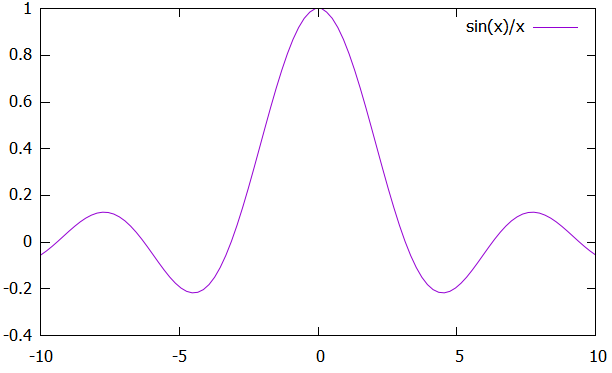
reset
plot sin(x)/x
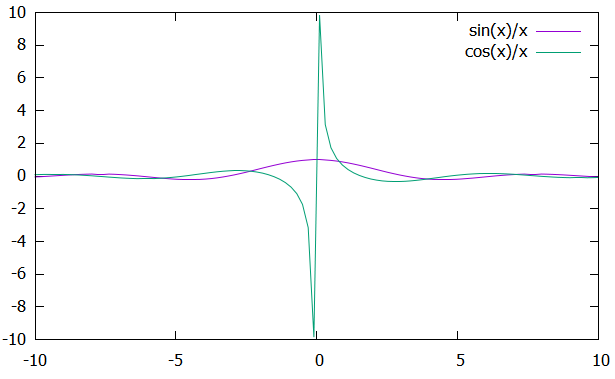
reset
 |  |
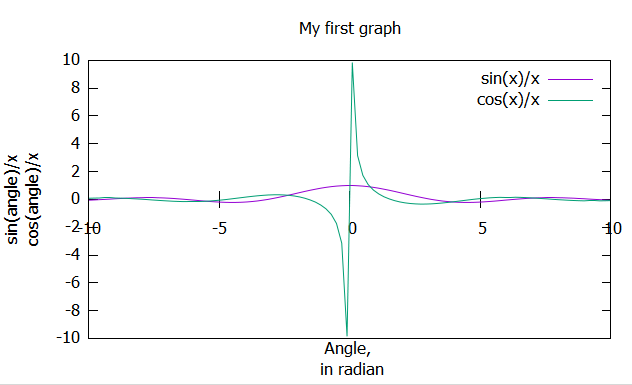
replot cos(x)/x
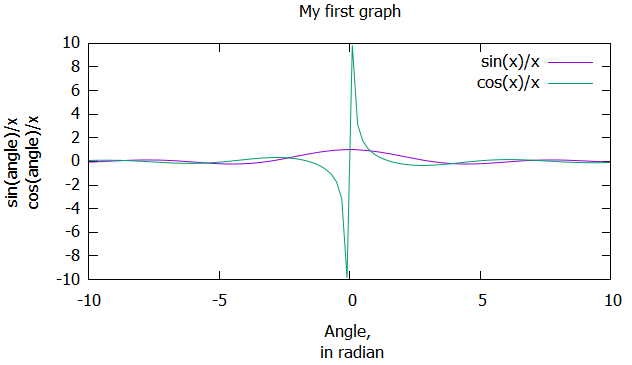
set title "My first graph"
set xlabel "Angle, \n in radian"
set ylabel "sin(angle)/x\ncos(angle)/x"
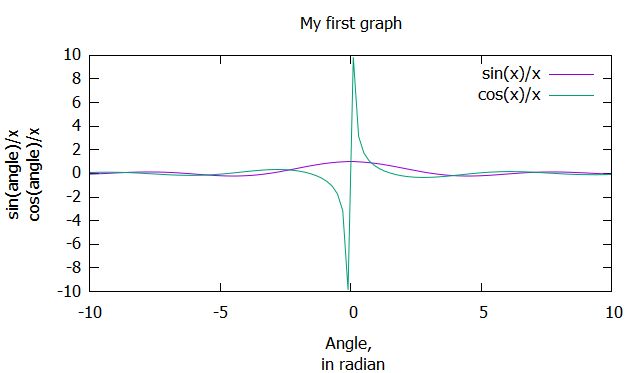
set title "My first graph"
set xlabel "Angle, \n in radian"
set ylabel "sin(angle)/x\ncos(angle)/x"
 |  |
set xtics axis
set xtics border
set xtics border
 |  |
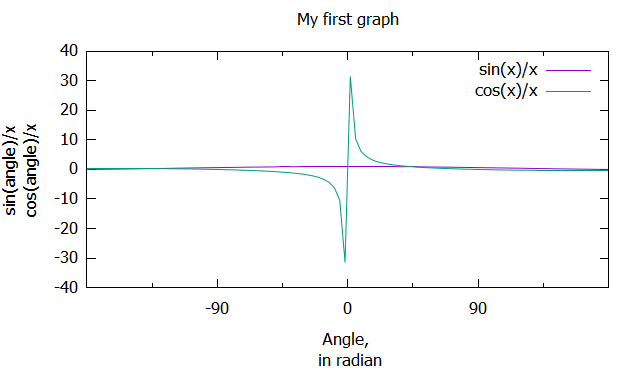
set xtics ("0" 0, "90" pi/2, "-90" -pi/2, "" pi/4 1, "" -pi/4 1, "" 3*pi/4 1, "" -3*pi/4 1)
//set x tics with value 90 at pi/2, -90 at -pi/2, default for major tics,
//set unlabelled x tics at pi/4, -pi/4, 3pi/4, -3pi/4, 1 represents minor tics
set grid
set xlabel "Angle,\n in degrees"
------------------------------------------------------------------------------------------------------------------------------------
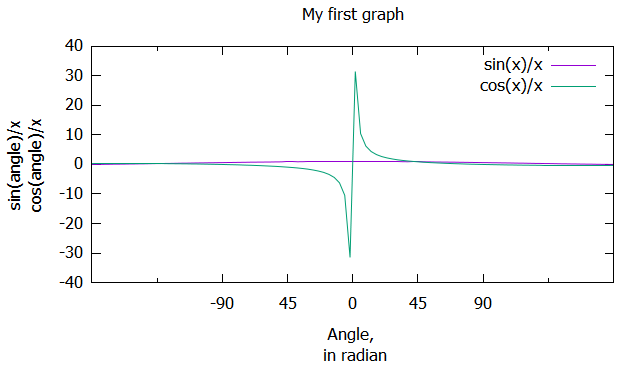
set xtics ("0" 0, "90" pi/2, "-90" -pi/2, "45" pi/4, "45" -pi/4, "" 3*pi/4 1, "" -3*pi/4 1)
//set x tics with value 90 at pi/2, -90 at -pi/2, default for major tics,
//set unlabelled x tics at pi/4, -pi/4, 3pi/4, -3pi/4, 1 represents minor tics
set grid
set xlabel "Angle,\n in degrees"
------------------------------------------------------------------------------------------------------------------------------------
set xtics ("0" 0, "90" pi/2, "-90" -pi/2, "45" pi/4, "45" -pi/4, "" 3*pi/4 1, "" -3*pi/4 1)
 |  |
 RSS Feed
