Here, we show another way to display the residuals.
Before doing so, the full commands to show previous residual plots are given:
-------------------------------------------------------------------------------------------------------------------------------------
cat logs | grep -w 'Time =' | cut -d' ' -f3 | tr -d ',' > time_tmp.dat
cat logs | grep 'Solving for Uy' | cut -d' ' -f9 | tr -d ',' > Uy_tmp.dat
cat logs | grep 'Solving for Ux' | cut -d' ' -f9 | tr -d ',' > Ux_tmp.dat
cat logs | grep 'Solving for omega' | cut -d' ' -f9 | tr -d ','> omega_tmp.dat
cat logs | grep 'Solving for k' | cut -d' ' -f9 | tr -d ','> k_tmp.dat
cat logs | grep 'Solving for p' | cut -d' ' -f9 | sed -n 'p;N' | tr -d ','> P_tmp.dat
paste time_tmp.dat Ux_tmp.dat Uy_tmp.dat P_tmp.dat k_tmp.dat omega_tmp.dat> residuals.dat
-------------------------------------------------------------------------------------------------------------------------------------
A 'plot.txt' file is created this time having the lines:
set logscale y
set title "Residuals"
set ylabel 'Residual'
set xlabel 'Time'
plot "residuals.dat" using 1:2 title 'Ux' with lines,\
"residuals.dat" using 1:3 title 'Uy' with lines,\
"residuals.dat" using 1:4 title 'P' with lines,\
"residuals.dat" using 1:5 title 'k' with lines,\
"residuals.dat" using 1:6 title 'omega' with lines
pause 20
reread
-------------------------------------------------------------------------------------------------------------------------------------
Use following command in the terminal:
gnuplot 'plot.txt'
or gnuplot plot.txt
or gnuplot plot.txt -
-------------------------------------------------------------------------------------------------------------------------------------
Now , let's go to second method which is more straightforward sometimes:
Create a file called 'plot2.txt' having the lines:
set logscale y
set title "Residuals"
set ylabel 'Residual'
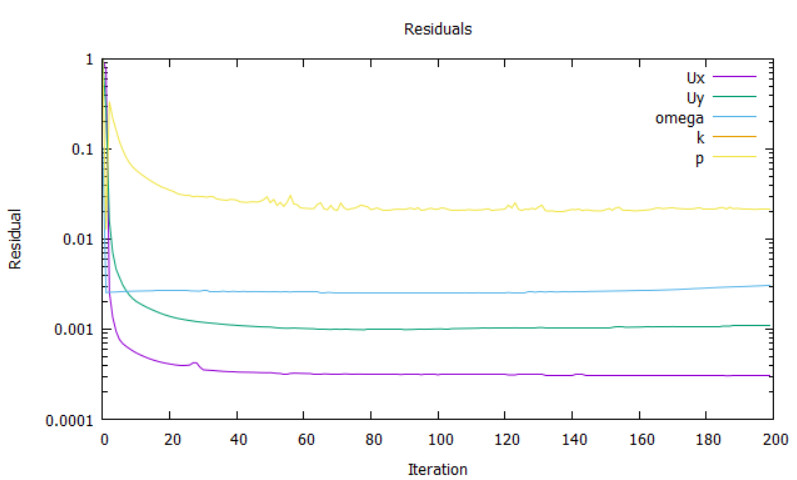
set xlabel 'Iteration'
plot "< cat logs | grep 'Solving for Ux' | cut -d' ' -f9 | tr -d ','" title 'Ux' with lines,\
"< cat logs | grep 'Solving for Uy' | cut -d' ' -f9 | tr -d ','" title 'Uy' with lines,\
"< cat logs | grep 'Solving for omega' | cut -d' ' -f9 | tr -d ','" title 'omega' with lines,\
"< cat logs | grep 'Solving for k' | cut -d' ' -f9 | tr -d ','" title 'k' with lines,\
"< cat logs | grep 'Solving for p' | cut -d' ' -f9 | sed -n 'p;N' | tr -d ','" title 'p' with lines
pause 20
reread
-------------------------------------------------------------------------------------------------------------------------------------
Use same commands in the terminal:
gnuplot 'plot3.txt'
or gnuplot plot3.txt
or gnuplot plot3.txt -
-------------------------------------------------------------------------------------------------------------------------------------
The only difference is here, the iteration starts from 0 and increased by 1. The previous method can auto-adjust the x value depending on the time read from logs.
Before doing so, the full commands to show previous residual plots are given:
-------------------------------------------------------------------------------------------------------------------------------------
cat logs | grep -w 'Time =' | cut -d' ' -f3 | tr -d ',' > time_tmp.dat
cat logs | grep 'Solving for Uy' | cut -d' ' -f9 | tr -d ',' > Uy_tmp.dat
cat logs | grep 'Solving for Ux' | cut -d' ' -f9 | tr -d ',' > Ux_tmp.dat
cat logs | grep 'Solving for omega' | cut -d' ' -f9 | tr -d ','> omega_tmp.dat
cat logs | grep 'Solving for k' | cut -d' ' -f9 | tr -d ','> k_tmp.dat
cat logs | grep 'Solving for p' | cut -d' ' -f9 | sed -n 'p;N' | tr -d ','> P_tmp.dat
paste time_tmp.dat Ux_tmp.dat Uy_tmp.dat P_tmp.dat k_tmp.dat omega_tmp.dat> residuals.dat
-------------------------------------------------------------------------------------------------------------------------------------
A 'plot.txt' file is created this time having the lines:
set logscale y
set title "Residuals"
set ylabel 'Residual'
set xlabel 'Time'
plot "residuals.dat" using 1:2 title 'Ux' with lines,\
"residuals.dat" using 1:3 title 'Uy' with lines,\
"residuals.dat" using 1:4 title 'P' with lines,\
"residuals.dat" using 1:5 title 'k' with lines,\
"residuals.dat" using 1:6 title 'omega' with lines
pause 20
reread
-------------------------------------------------------------------------------------------------------------------------------------
Use following command in the terminal:
gnuplot 'plot.txt'
or gnuplot plot.txt
or gnuplot plot.txt -
-------------------------------------------------------------------------------------------------------------------------------------
Now , let's go to second method which is more straightforward sometimes:
Create a file called 'plot2.txt' having the lines:
set logscale y
set title "Residuals"
set ylabel 'Residual'
set xlabel 'Iteration'
plot "< cat logs | grep 'Solving for Ux' | cut -d' ' -f9 | tr -d ','" title 'Ux' with lines,\
"< cat logs | grep 'Solving for Uy' | cut -d' ' -f9 | tr -d ','" title 'Uy' with lines,\
"< cat logs | grep 'Solving for omega' | cut -d' ' -f9 | tr -d ','" title 'omega' with lines,\
"< cat logs | grep 'Solving for k' | cut -d' ' -f9 | tr -d ','" title 'k' with lines,\
"< cat logs | grep 'Solving for p' | cut -d' ' -f9 | sed -n 'p;N' | tr -d ','" title 'p' with lines
pause 20
reread
-------------------------------------------------------------------------------------------------------------------------------------
Use same commands in the terminal:
gnuplot 'plot3.txt'
or gnuplot plot3.txt
or gnuplot plot3.txt -
-------------------------------------------------------------------------------------------------------------------------------------
The only difference is here, the iteration starts from 0 and increased by 1. The previous method can auto-adjust the x value depending on the time read from logs.
 RSS Feed
