First, let's list all available files in the main case file:

Notice that the logs file is generated by using command:
icoFoam > logs
Which saves both error and data into logs.
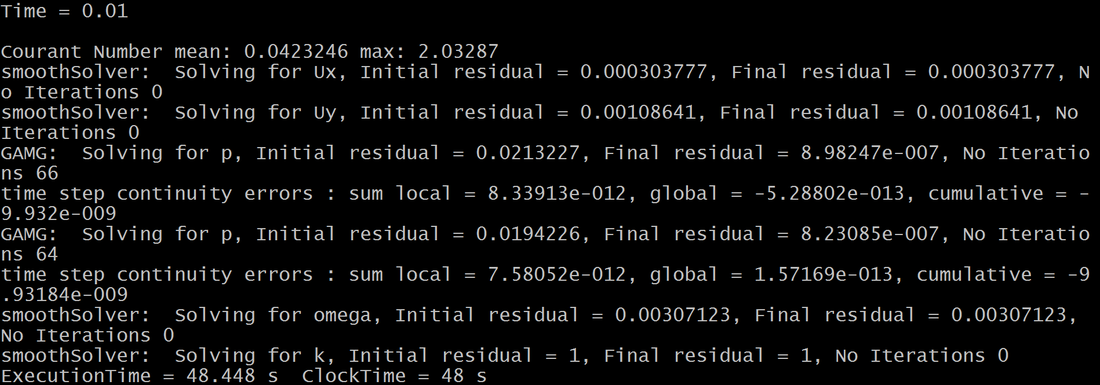
Let's see part of the logs file by typing : cat logs
icoFoam > logs
Which saves both error and data into logs.
Let's see part of the logs file by typing : cat logs
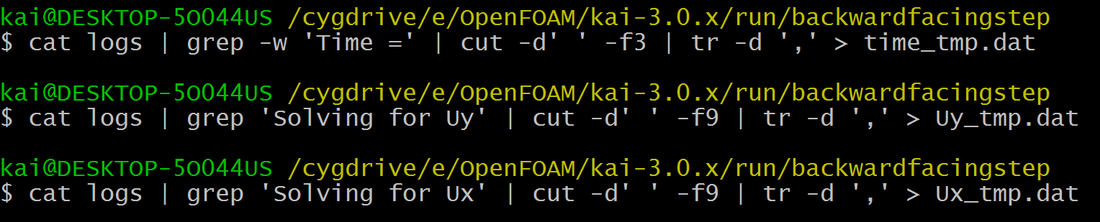
I will apply the Linux command in the first post here, and retrieve the individual time, Ux, Uy data to separate files.
cat logs | grep -w 'Time =' | cut -d' ' -f3 | tr -d ',' > time_tmp.dat
//grep - w, Select only those lines containing matches that form whole words 'Time='
//time data will be retrieved to time_tmp.dat
cat logs | grep 'Solving for Uy' | cut -d' ' -f9 | tr -d ',' > Uy_tmp.dat
//Uy data will be retrieved to Uy_tmp.dat
cat logs | grep 'Solving for Ux' | cut -d' ' -f9 | tr -d ',' > Ux_tmp.dat
//Ux data will be retrieved to Ux_tmp.dat
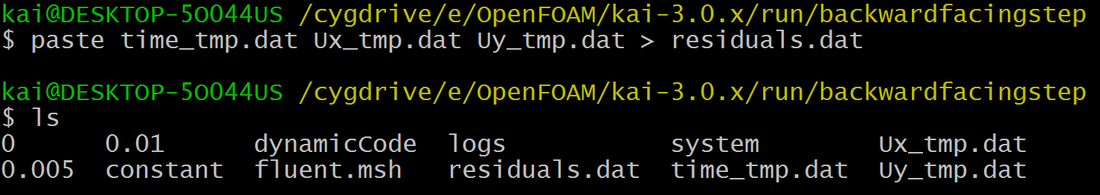
paste time_tmp.dat Ux_tmp.dat Uy_tmp.dat Uz_tmp.dat > residuals.dat
//time, Ux, Uy data will be pasted to residuals.dat
Then we have:
cat logs | grep -w 'Time =' | cut -d' ' -f3 | tr -d ',' > time_tmp.dat
//grep - w, Select only those lines containing matches that form whole words 'Time='
//time data will be retrieved to time_tmp.dat
cat logs | grep 'Solving for Uy' | cut -d' ' -f9 | tr -d ',' > Uy_tmp.dat
//Uy data will be retrieved to Uy_tmp.dat
cat logs | grep 'Solving for Ux' | cut -d' ' -f9 | tr -d ',' > Ux_tmp.dat
//Ux data will be retrieved to Ux_tmp.dat
paste time_tmp.dat Ux_tmp.dat Uy_tmp.dat Uz_tmp.dat > residuals.dat
//time, Ux, Uy data will be pasted to residuals.dat
Then we have:
Now, create a file called plot: touch plot
type in:
set logscale y
set title "Residuals"
set ylabel 'Residual'
set xlabel 'Time'
plot "residuals.dat" using 1:2 title 'Ux' with lines,\
"residuals.dat" using 1:3 title 'Uy' with lines //1st column as x, 3rd column as Uy, plot as lines
pause 1 //gnuplot.sourceforge.net/docs_4.2/node99.html
reread
Go back to terminal, and use command:
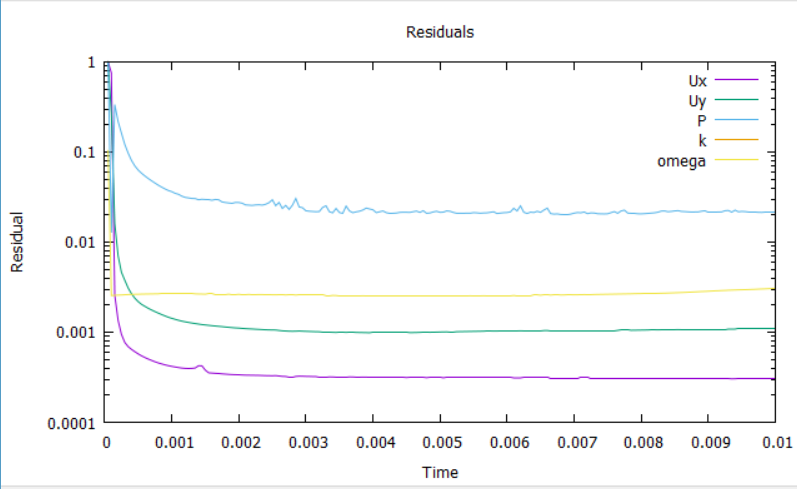
gnuplot 'plot'
Below is the result generated: (omega, p and k also included, ctrl+c to exit)
type in:
set logscale y
set title "Residuals"
set ylabel 'Residual'
set xlabel 'Time'
plot "residuals.dat" using 1:2 title 'Ux' with lines,\
"residuals.dat" using 1:3 title 'Uy' with lines //1st column as x, 3rd column as Uy, plot as lines
pause 1 //gnuplot.sourceforge.net/docs_4.2/node99.html
reread
Go back to terminal, and use command:
gnuplot 'plot'
Below is the result generated: (omega, p and k also included, ctrl+c to exit)
Finally, the command to extract P data:
cat logs | grep 'Solving for p' | cut -d' ' -f9 | sed -n 'p;N' | tr -d ','> P_tmp.dat
//Print every other line, starting with line 1
if you have
GAMG: Solving for p, Initial residual = 0.00490348, Final residual = 0.000327938, No Iterations 2
GAMG: Solving for p, Initial residual = 0.000625867, Final residual = 4.67654e-05, No Iterations 3
GAMG: Solving for p, Initial residual = 0.000200362, Final residual = 1.50974e-05,No Iterations 4
Use:
cat logs | grep 'Solving for p' | cut -d' ' -f9 | sed -n 'p;N;N' | tr -d ','> P_tmp.dat
 RSS Feed
